Business Model
When we talk about Ohio State’s business model for distance education, we’re really referring to two separate financial models: the tuition model – what students pay for distance education – and the budget model – how that revenue is distributed across the university.
These financial models were approved by the Office of Academic Affairs and the University Senate Fiscal Committee in 2013 and are reevaluated on a yearly basis. These models only apply to students labeled/identified with the ONL (online) sub-plan in the student information system and to Distance Learning (DL) and Distance Enhanced (DH) courses. For more information, see the Definitions page.
How the Tuition Model Works
In addition to instructional and general fees, Ohio State Online students pay a $100 distance fee each term, which pays for a variety of online education resources, such as the remote proctoring tool Proctorio that is fully integrated into CarmenCanvas. Out-of-state students are also assessed a non-resident surcharge of $200 per term. For more information, visit online.osu.edu/tuition-and-fees.
How the Budget Model Works
Just like traditional face-to-face programs at Ohio State, revenue calculation for distance education programs is based on a two-year average. Regardless of delivery mode, distribution of revenue for new programs begins the year after the program is launched. In addition, marginal revenues for both types of programs, face-to-face and online, are subject to a 24% Support Unit Tax.
However, unlike face-to-face programs, online programs are not charged Student Service Assessments (SSAs) 1, 2 or 3.
This difference means distance education programs bring in more revenue to your college per tuition dollar than face-to-face programs do.
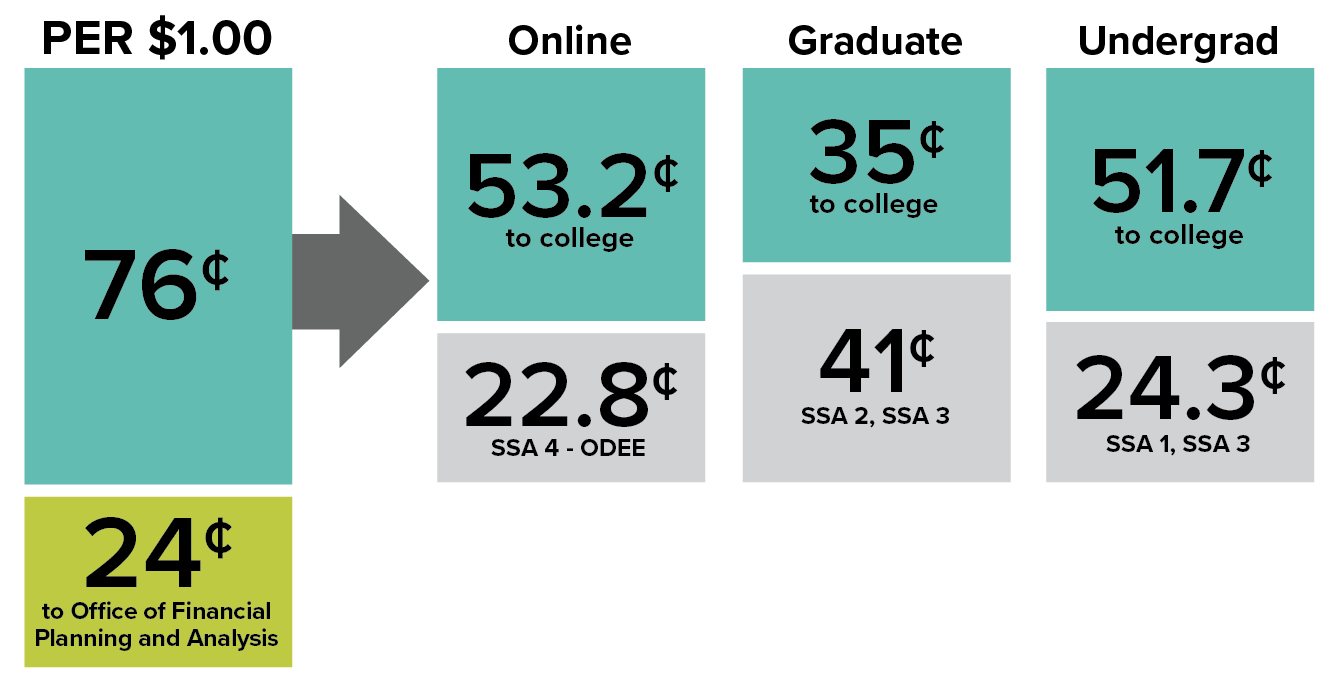
Instead, online programs are charged SSA 4, which funds ODEE’s instructional design and marketing services as well as ongoing program support.
The tables below illustrate the difference in revenue calculation between face-to-face programs and distance education programs.
Revenue Calculation for the average cost of one credit hour in Fiscal Year 2019*
| FACE-TO-FACE PROGRAM | DISTANCE EDUCATION | |
|---|---|---|
| Average Tuition | $1,025.55 | $1,025.55 |
| Average Subsidy | $399.54 | $399.54 |
| Total Revenue | $1,225.32 | $1,225.32 |
| Support Unit Tax | $294.08 (24%) | $294.08 (24%) |
| Net Marginal Revenue | $931.24 | $931.24 |
| SSA2 Charge | $492.26 | NA |
| SSA3 Charge | $4.36 | NA |
| SSA4 DE Assessment | NA | $279.37 |
| Revenue to College | $434.62 (47%) | $651.87 (70%) |
*Since the university does not receive subsidy for out-of-state students, this example is conservative, estimating 50% of subsidy to account for out-of-state students. On average about 80% of online program students are in-state residents.
| FACE-TO-FACE PROGRAM | DISTANCE EDUCATION | |
|---|---|---|
| Average Tuition | $390.84 | $390.84 |
| Average Subsidy | $218.27 | $218.27 |
| Total Revenue | $499.98 | $499.98 |
| Support Unit Tax | $119.99 (24%) | $119.99 (24%) |
| Net Marginal Revenue | $397.98 | $397.98 |
| SSA1 Charge | $118.12 | NA |
| SSA3 Charge | $4.36 | NA |
| SSA4 DE Assessment | NA | $114.00 |
| Revenue to College | $257.50 (68%) | $265.98 (70%) |
*Since the university does not receive subsidy for out-of-state students, this example is conservative, estimating 50% of subsidy to account for out-of-state students. On average about 80% of online program students are in-state residents.
Your unit’s fiscal officer can model a projection for your program using our budget model template.